
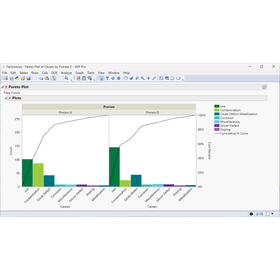
JMP is not just for analysis! Ways to utilize data processing, automation, and visualization.
Doesn't it bother you that 'data processing takes time,' 'you are repeating the same tasks every time,' and 'creating graphs is surprisingly difficult'?
As the importance of data utilization increases, a significant amount of time is spent on tasks such as data processing and graph creation. Particularly in spreadsheet software, errors due to repetitive manual work are often a challenge. JMP not only offers advanced statistical analysis but also has a wealth of features for data preprocessing and visualization. In this seminar, we will introduce methods to streamline data operations, from data loading to processing, formatting, graph creation, and automation. 【Target Audience】 - Individuals from any industry who regularly process and graph data using spreadsheet software, etc. - Those who feel burdened by the time required for monthly or weekly report and graph creation. - Those who want to streamline data preparation tasks and spend more time on analysis and reporting. - Those who wish to learn how to utilize JMP not only for analysis but also for data preprocessing and visualization. 【Main Content】 - Loading various tabular data formats - Streamlining data processing and formatting - Automating routine tasks - Creating expressive graphs * Content is subject to change. * This will be a format where participants can view the instructor's explanations and demonstrations.
